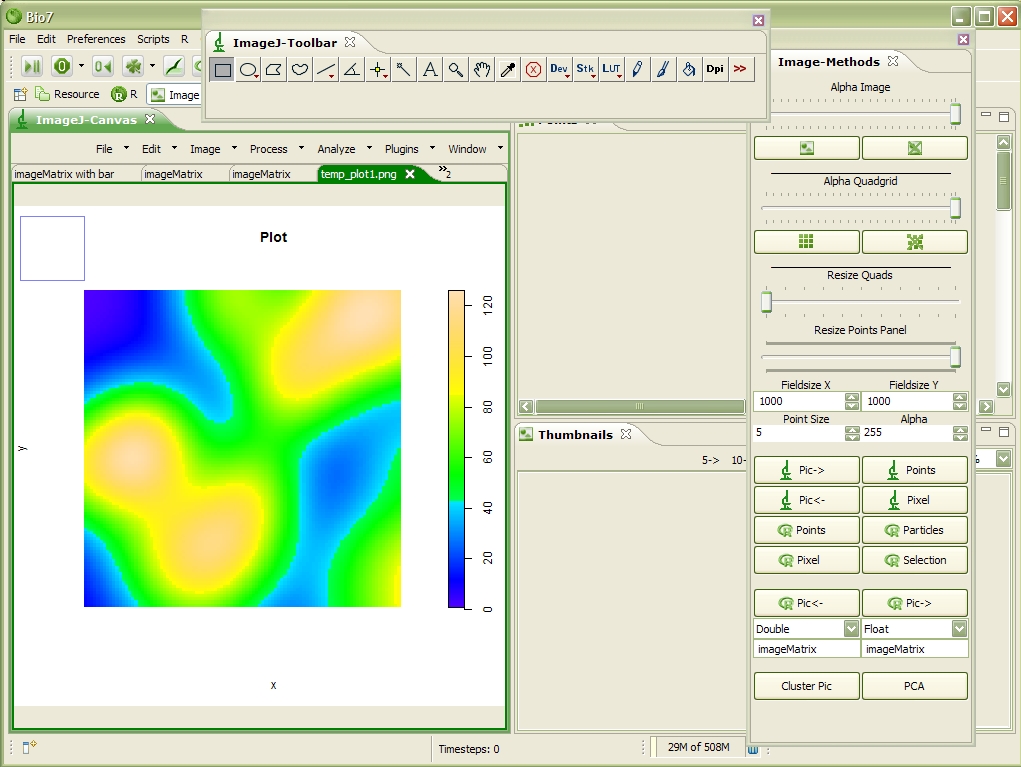
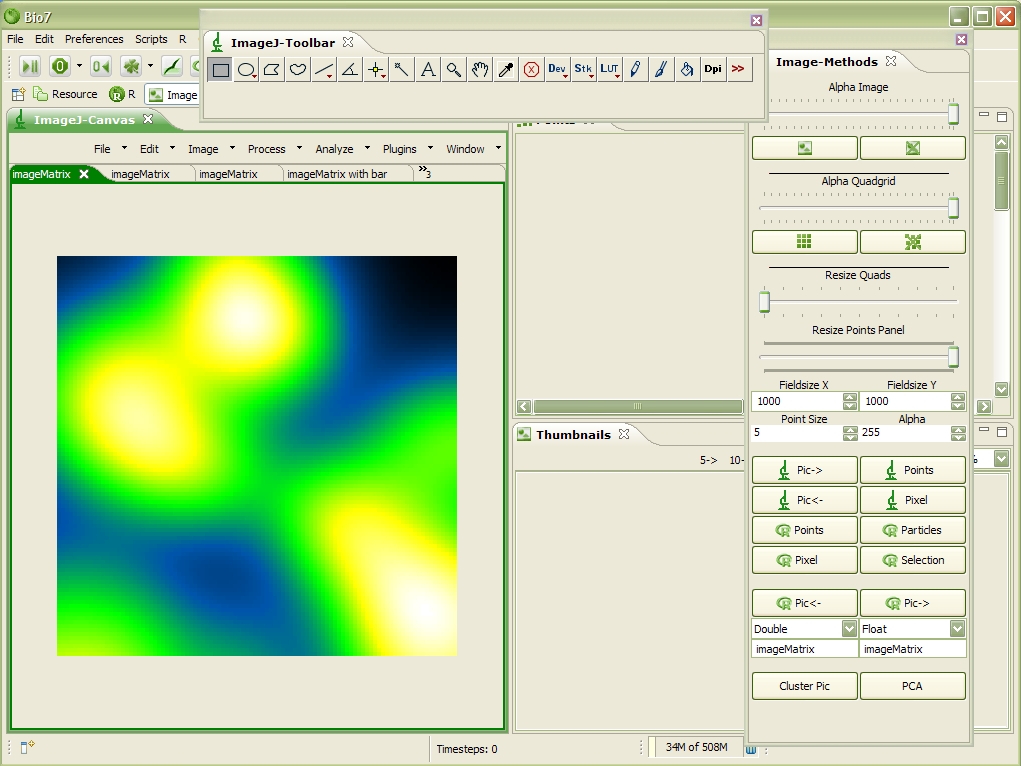
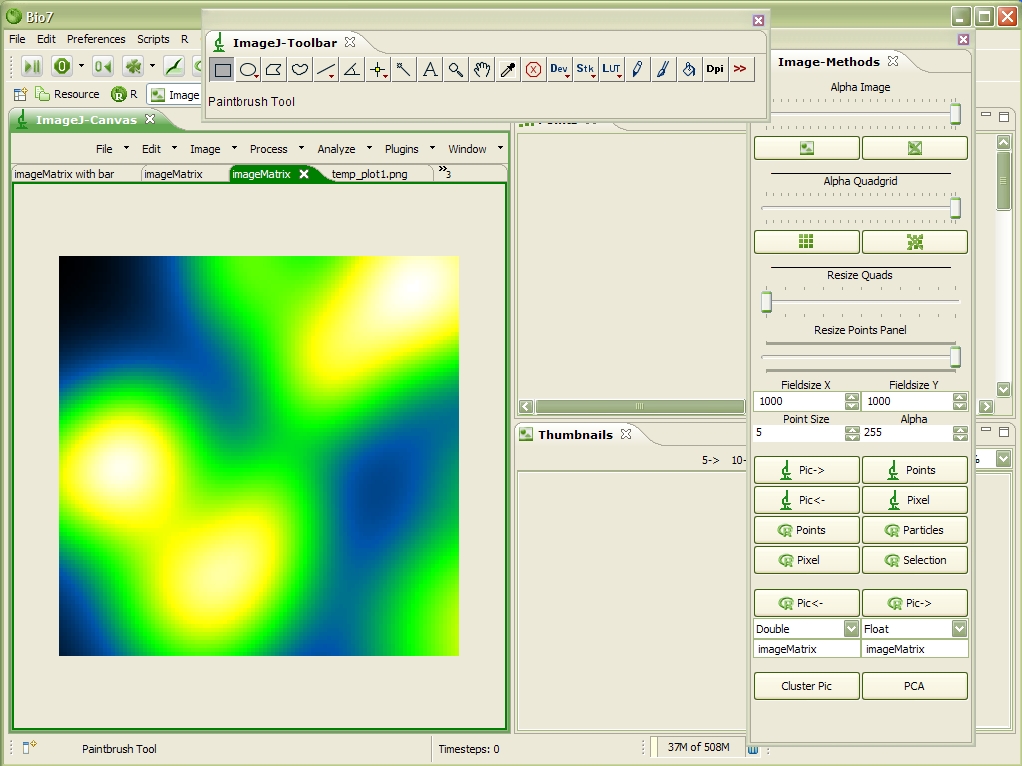
If you plot data in R and you would like to display the same data in the ImageJ view it is necessary to transfer the data matrix to ImageJ. The first thing which can be noticed is that the image data is displayed rotated because of the Bio7 approach to transfer data forth and back in the following way: imagedata(x,y) whereas (x0,y0) can be found in the upper left corner (Java coordinates in images!). In R values in a matrix are referenced with matrix(rows, columns) thats why images plotted with R and images (matrix data) displayed in ImageJ are different oriented.
Plot created with R using a spatstat (spatial analysis package) example and displayed in ImageJ
Pure R matrix data transferred as Floats, coloured with a LUT (LookUpTable) and displayed in ImageJ (Scalebar could be added, too).
If you would like to get the same view in ImageJ as the R plot simply transform the image (for the spatstat example rotate the image 90° in the left direction; for an image plot view like R flip the image vertically).
Of course another possibility to get the same result would be to adjust the coordinate system in the R plot. But this example illustrates the differences between the R coordinates and the ImageJ (Java) coordinates.


