18.11.2015
In the current release of Bio7 2.3 two new plot preferences are available to automatically plot data with the size of the visible display (as an image) or with the size of available ImageSizeX and ImageSizeY R workspace variables.
The second option is handy if you transfer images from ImageJ to the R workspace (the variables ImageSizeX and ImageSizeY will be autmatically created, too). You can then create an R image plot (e.g. from a classification) in the same size as an overlay of the original image (in turn plotted and overlayed in ImageJ).
Video:
Improvements of the R editor for the upcoming Bio7 2.4 release
For the upcoming release of Bio7 I also add new features to the Bio7 R editor.
Among other things until now I improved the code completion. If you now type a a left parenthesis you get a help tooltip if the function is known (if you load frequent used R packages with the Bio7 GUI interface the package function context will be added to the code completion, tooltip interface).
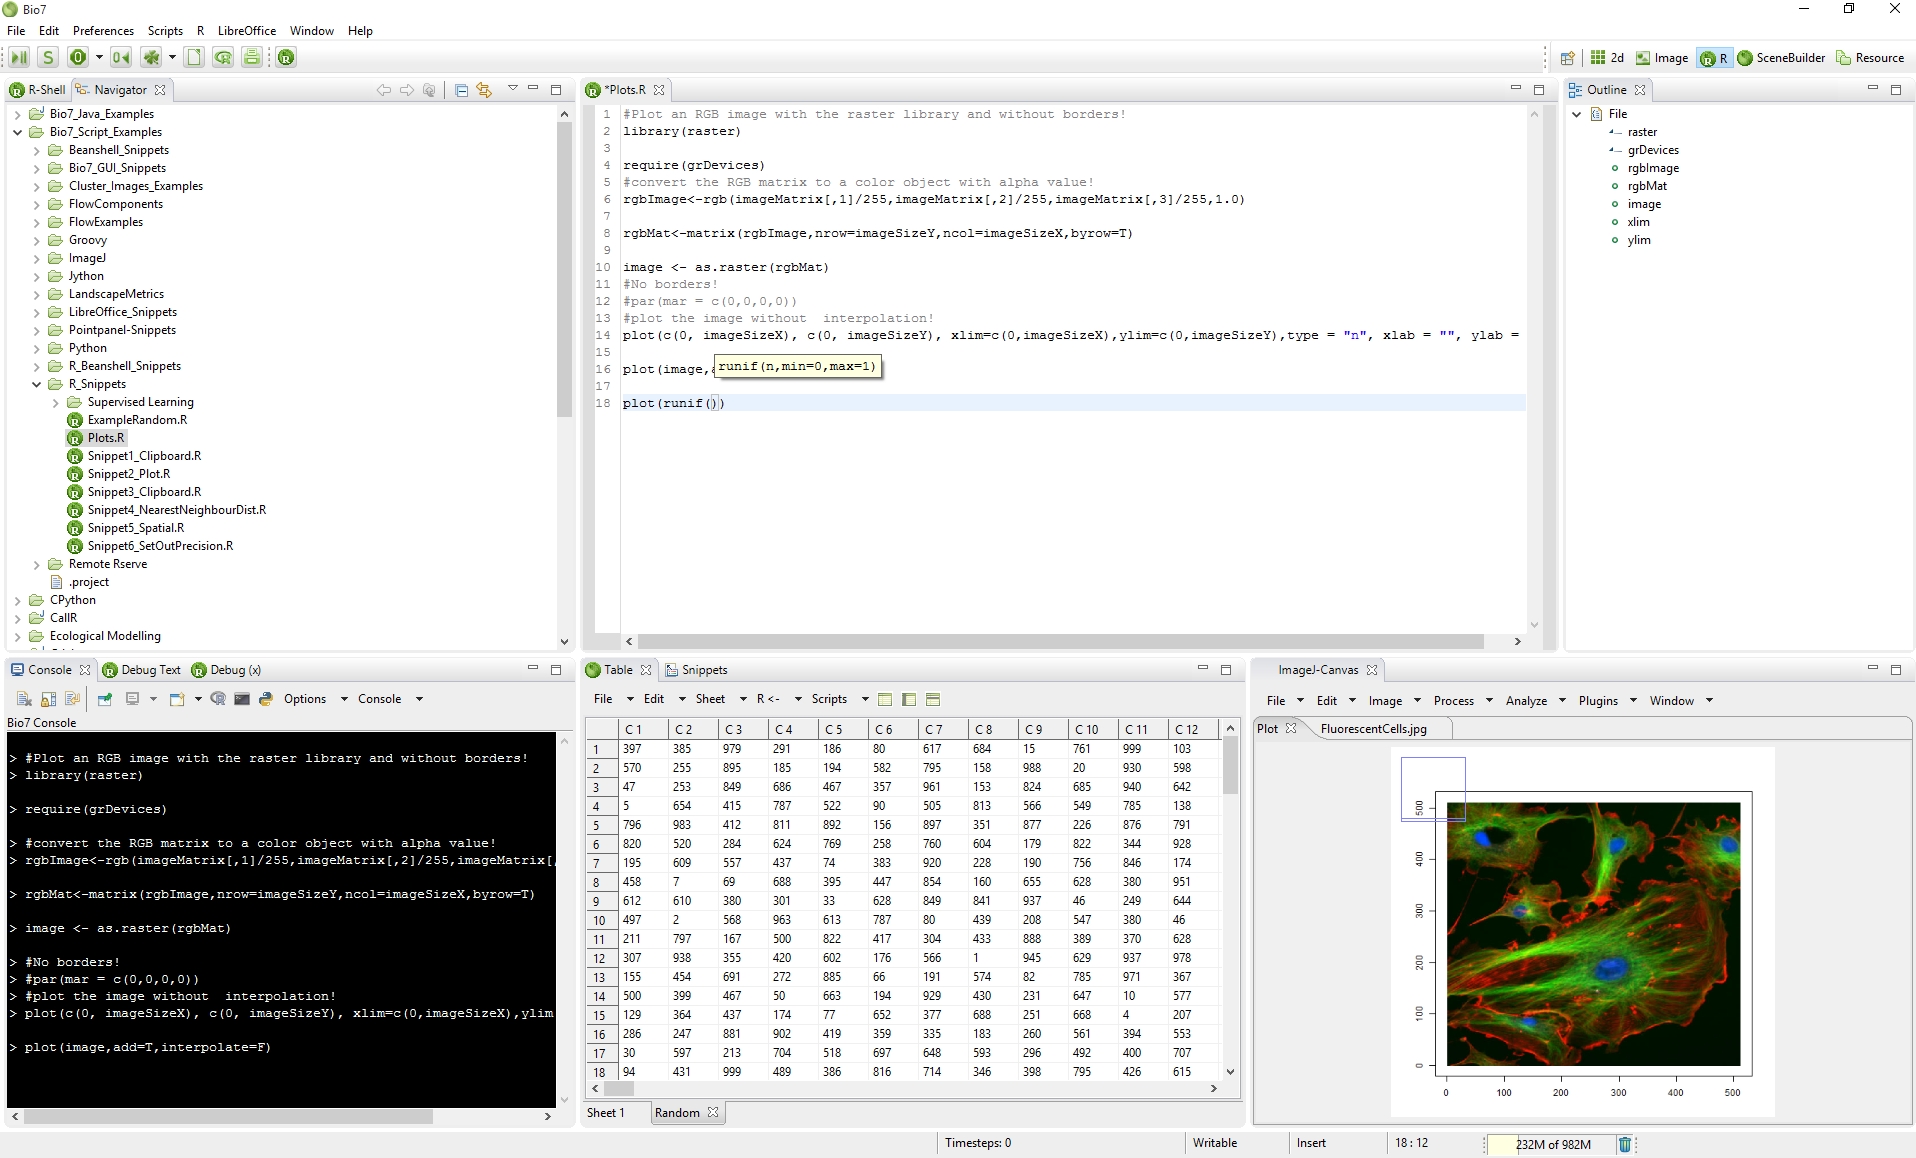
Screenshot 1: Improved tooltip when a left parenthesis is typed.
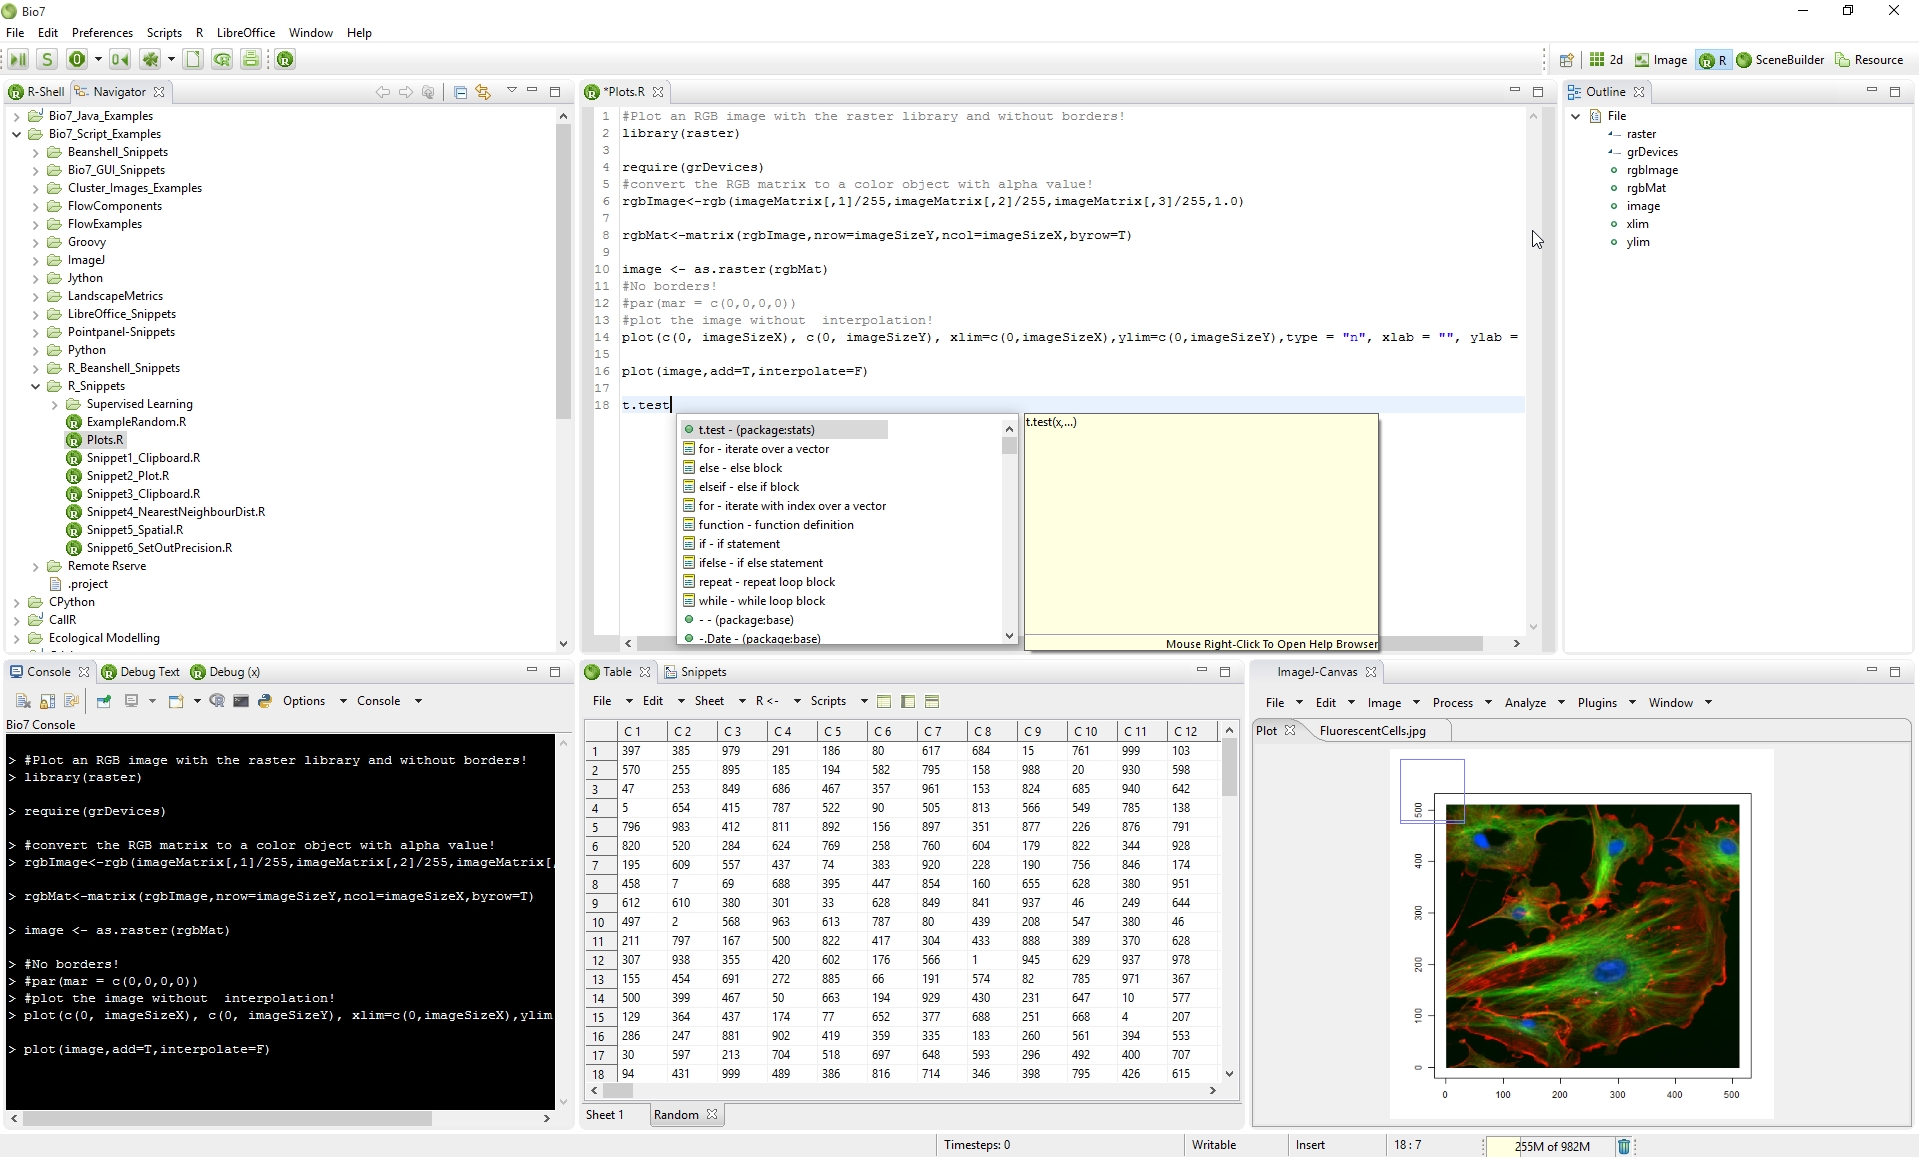
Figure 2: Code completion (Keys: CTRL+Space) now preselects the right context (e.g. functions with ‘.’ char)
In addition I added a function to set right parentheses, braces, etc. automatically when left parentheses, etc. are typed in the R editor.